Chart.js is an open-source JavaScript library that makes it very easy to build charts for your website. In this tutorial, I’d like to provide step by step guide on how to combine chart.js with another angular package - ‘ng2-charts’.
Firstly, we need to understand some properties of chart.js:
- data: Set of points of the chart, it should be MultiDataSet only for line, bar, radar, and doughnut, otherwise SingleDataSet
- datasets: Data see about, the label for the dataset which appears in the legend and tooltips
- labels: x-axis labels. It’s necessary for charts: line, bar, and radar. And just labels (on hover) for charts: polarArea, pie, and a doughnut. The label is either a single string, or it may be a string[] representing a multi-line label where each array element is on a new line.
- type: Indicates the type of charts, it can be: line, bar, radar, pie…
- options: Chart options. See Chart.js documentation for more details.
- colors: Data colors, will use the default and|or random colors if not specified
- legend: If true show legend below the chart, otherwise not be shown
Let’s start to create a sample chart
We need to create an angular application with Angular CLI:
$ ng new myChart — routing
This command is downloading the default Angular project template and all dependencies are installed.
2. Install ng2-charts and chart.js dependency. Go to your root project and run commands
npm install ng2-charts — save
npm install chart.js — save
Now, you need to import ChartsModule into your app module or feature module. In this example, I will import to AppModule
import { BrowserModule } from "@angular/platform-browser";
import { NgModule } from "@angular/core";
import { ChartsModule } from "ng2-charts";
import { AppComponent } from "./app.component";
@NgModule({
  declarations: [AppComponent],
  imports: [BrowserModule, ChartsModule],
  providers: [],
  bootstrap: [AppComponent]
})
export class AppModule {}
ng2-charts chart types
There is one directive for all chart types: base chart, and 8 types of charts: line, bar, radar, pie, polar area, doughnut, bubble, and scatter.
Let’s build a sample bar chart using the below and update your app.component.html
<div class="chart-container" style="display: block">
<canvas baseChart
   [datasets]="barChartData"
   [labels]="barChartLabels"
   [options]="barChartOptions"
   [legend]="barChartLegend"
   [chartType]="barChartType">
</canvas>
</div>
And the last step, we need to init chart data for the chart. Update your app.component.ts as below
import { Component } from '@angular/core';
@Component({
  selector: 'app-root',
  templateUrl: './app.component.html',
  styleUrls: ['./app.component.scss']
})
export class AppComponent {
  constructor() {}
  public barChartOptions = {
    scaleShowVerticalLines: false,
    responsive: true
};
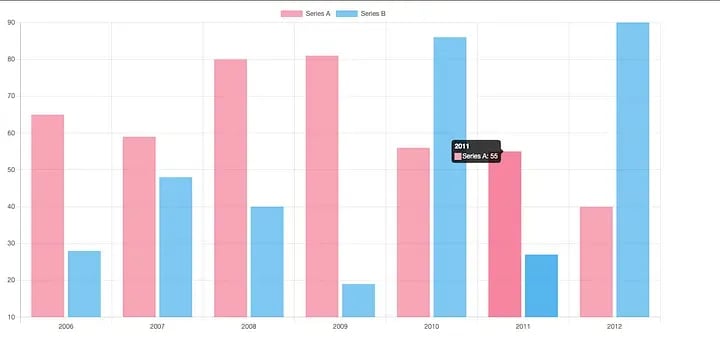
  public barChartLabels =['2006','2007','2008','2009','2010','2011','2012'];
  public barChartType = 'bar';
  public barChartLegend = true;
  public barChartData = [
   { data: [65, 59, 80, 81, 56, 55, 40], label: 'Series A' },
   { data: [28, 48, 40, 19, 86, 27, 90], label: 'Series B' }
  ];
}
Start your application and view your result at http://localhost:4200
$ ng serve
Then you can see the chart rendered as below screenshot
Noted: Detecting when the canvas size changes can not be done directly from the canvas element. Chart.js uses its parent container to update the canvas render and display sizes.